Observe Chaos Scenario
Before you begin
You must schedule a chaos scenario. To know more about scheduling chaos scenarios click here
After scheduling a chaos scenario, you can track the status of the chaos scenario run from the Runs tab in the Litmus Chaos Scenario. The status that is currently displayed are:
- Failed
- Running
- Completed
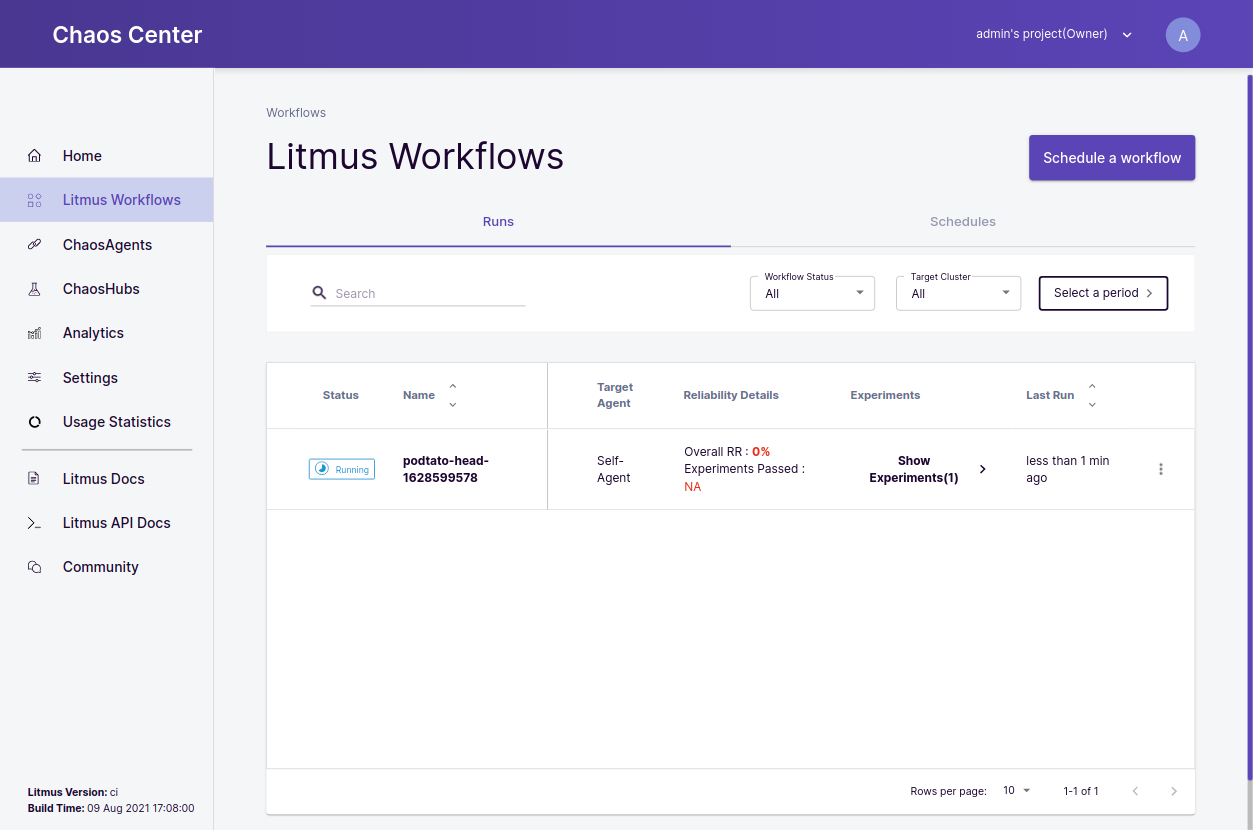 Chaos Scenario Runs Table showing a Running Chaos Scenario
you can analyze a chaos scenario using two methods:
Visualize the chaos scenario run graph
After scheduling a chaos scenario, you can click on the Show the chaos scenario option or click on the chaos scenario name to see the real-time graph of the chaos scenario.
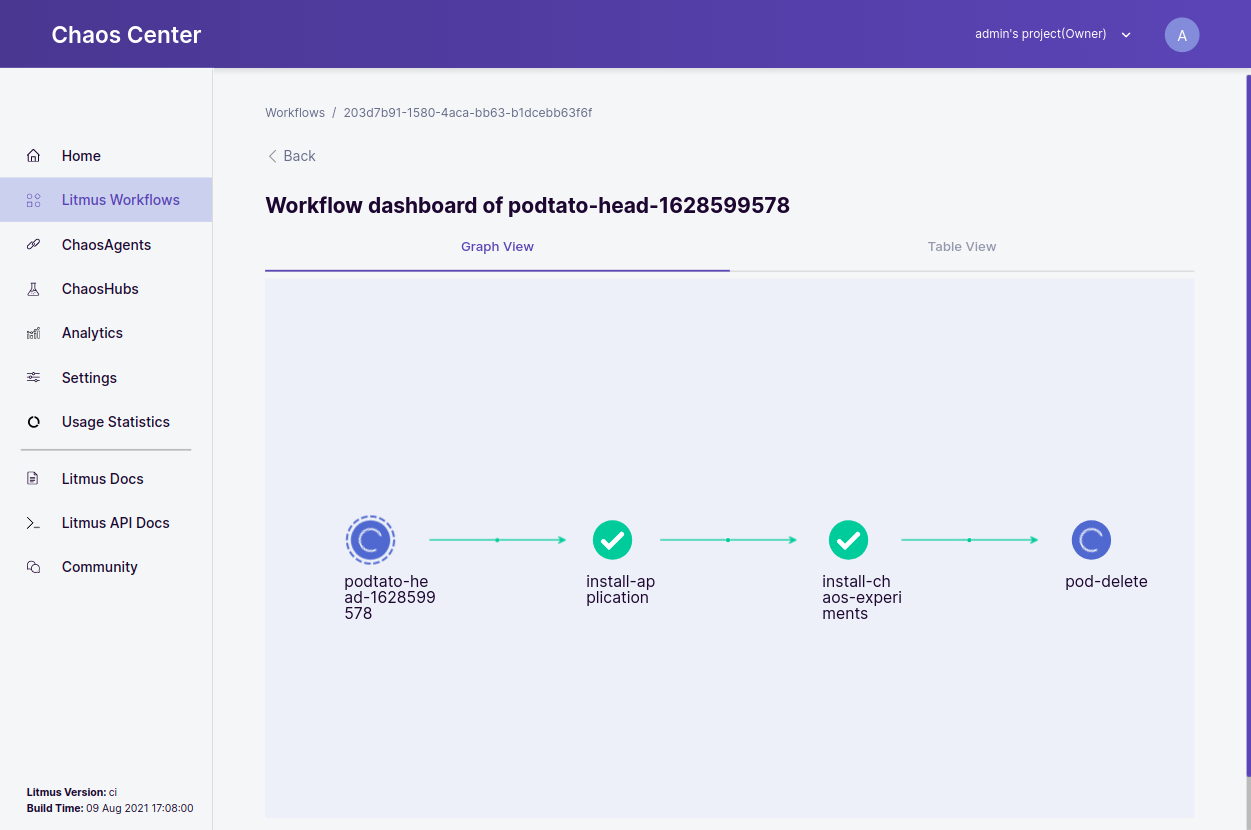 Graph of Podtato Head chaos scenario
The graph consists of useful information such as :
- Phase of individual nodes.
- Total time taken for the nodes to execute.
- Structure of the experiments (Serial or Parallel experiments).
You can also visualize the non Chaos scenarios. The logs of individual nodes are also available here.
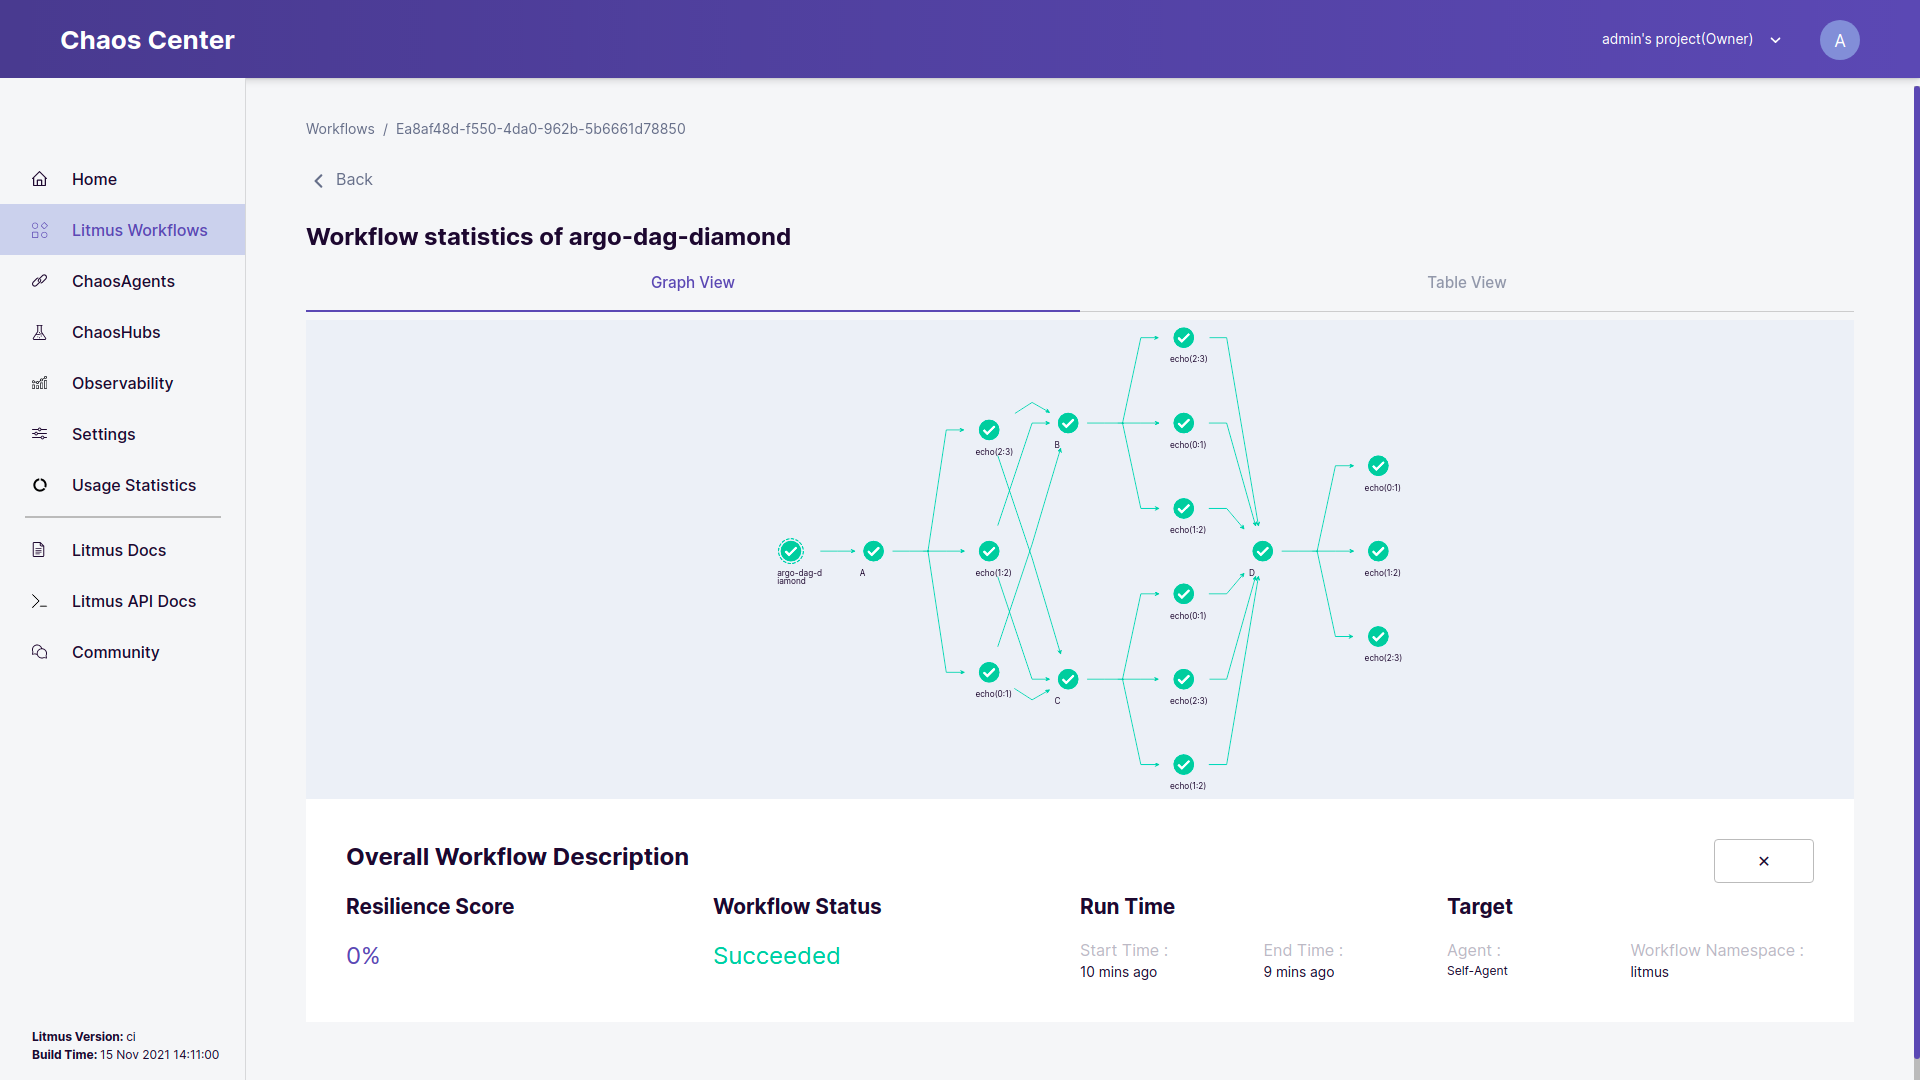 Graph of a non Chaos Scenario
View logs of individual nodes
you can click on the nodes to get the logs of that particular step. If the revert-chaos step is disabled, the complete logs are available which include the runner pod logs and the chaos logs.
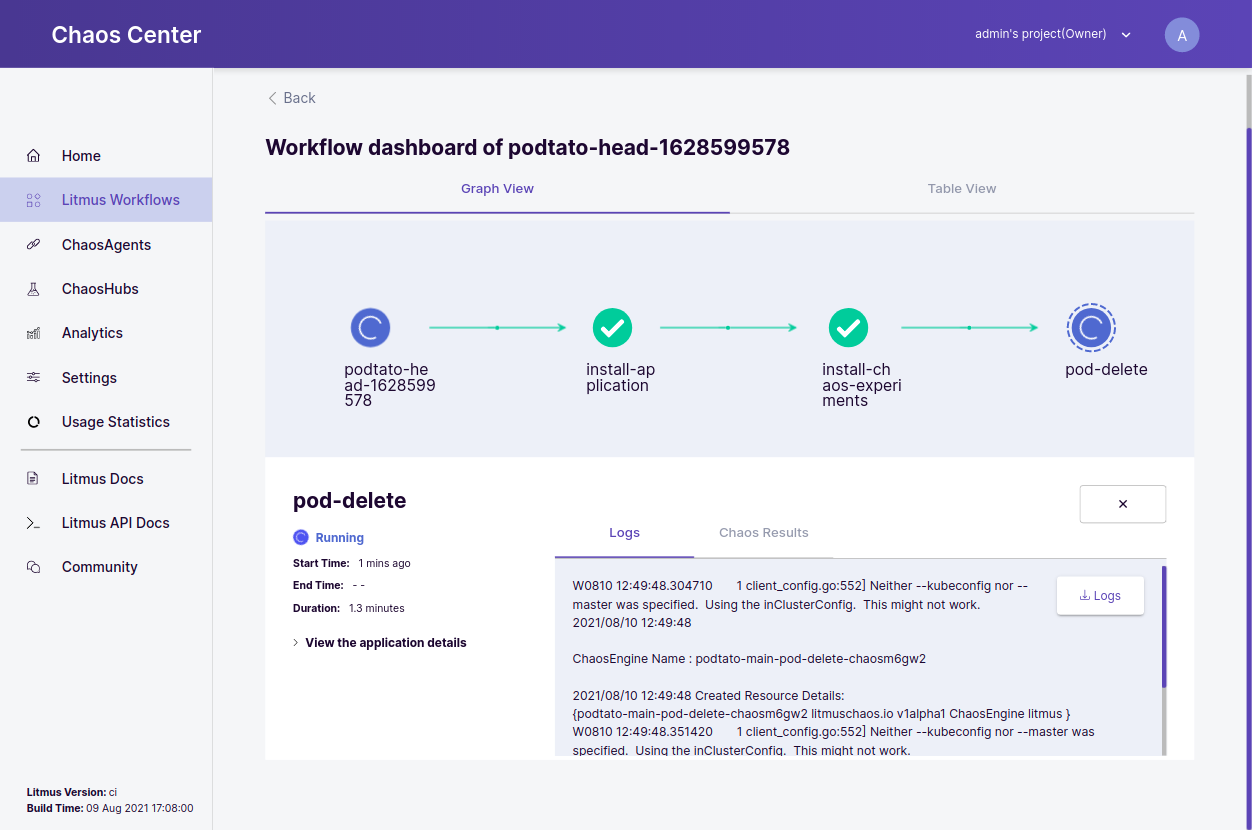 Podtato Head chaos scenario with Logs
View chaos results
Once the experiment completes, the Chaos Results are also available alongside the logs. The Chaos Results are directly fetched from the ChaosResult CRD.
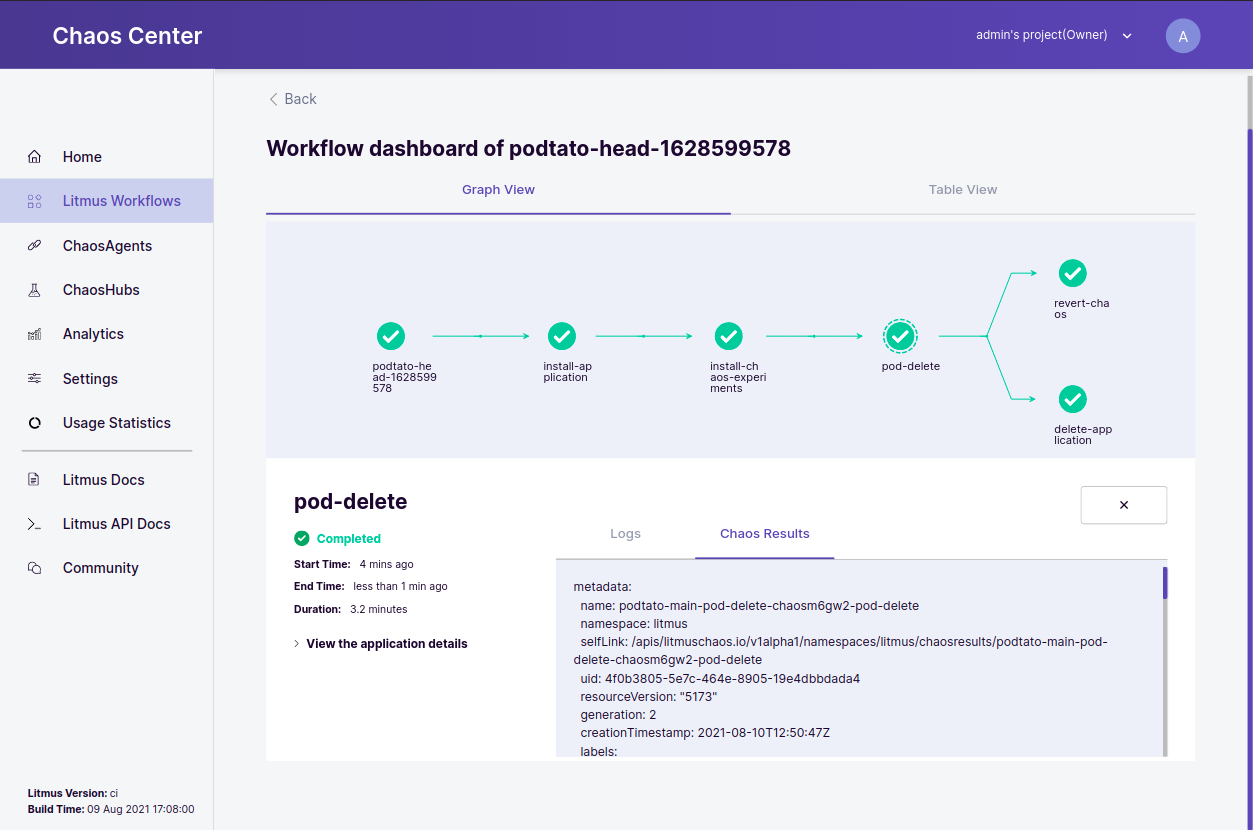 Podtato Head chaos scenario with chaos logs and chaos result of generic/pod-delete experiment
Resilience Score Calculation
A Resilience Score is the measure of how resilient your chaos scenario run is considering all the chaos experiments and their individual result points. This calculation takes into account the individual experiment weights (from a range of 1-10) which are relative to each other.
Once a weight has been assigned to the experiment, we look for the Probe Success Percentage for that experiment itself (Post Chaos) and calculate the total resilience result for that experiment as a multiplication of the weight given and the probe success percentage returned after the Chaos Run.
Total Resilience for one single experiment = (Weight Given to that experiment * Probe Success Percentage)
If an experiment doesn't have a probe in it, the probe success percentage returned can either be 0 or 100 based on the experiment verdict. If the experiment passed then it returns 100 else 0.
The Final Resilience Score is calculated by dividing the total test result by the sum of all the weights of all the experiments combined in a single chaos scenario.
For example, if we consider two experiments in a chaos scenario, here is what the calculation would look like.
Considering Probe Success Percentage is 100
| Experiment | Weight | Probe Success Percentage | Total Test Result |
|---|---|---|---|
| exp1 | 3 | 100 | (3 * 100) = 300 |
| exp2 | 9 | 100 | (9 * 100) = 900 |
| Weight Sum = 3 + 9 = 12 | Total Test Result = 300 + 900 = 1200 |
Resilience Score = Total Test Result / Weight Sum
                 = 1200 / 12
                 = 100%
Analytics from the runs tab
Once the chaos scenario run execution completes, you can click the Show the analytics option in the Runs tab of Litmus Chaos Scenarios which opens up a Chaos Scenario Dashboard which can also be accessed from the Analytics section and is explained more here. This analytics can be crucial to analyse the Cron Chaos Scenarios.